Building Interactive Maps
with PHP and JavaScript

Bonjour !
@pierstoval
Alex Rock


Freelance PHP/Symfony dev & training consultant

Why a map?
A medieval world with horrific and gothic overtones
A table-top role-playing game
4 music albums
A board game (the Black Rose)

And more to come...
Shadows of Esteren
The genesis of a "map" application
What IS a map?
What IS a map?
What IS a map?
Zones
What IS a map?
Places
What IS a map?
Routes
What IS a map?
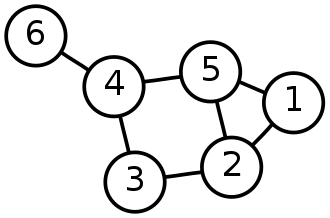
Crossroads
Constraints
Marker: {x,y}
Route: [ {x₀, y₀}, {x₁, y₁} ]
Zone: [ {x₀, y₀}, {x₁, y₁}, {x₂, y₂} ]
○ MarkerType
○ RouteType
○ ZoneType
○ TransportSpeedModifier
○ TransportType
"start" marker
"end" marker
Existing map providers
Proprietary
Baidu Maps ; Bing Maps ; Bhuvan ; Google Maps ; HERE WeGo ; Map World ; Mappy ; MapQuest ; Qwant Maps ; ViaMichelin ; WikiMapia ; etc.
Public domain
OpenStreetMap ; OpenSeaMap
But...
🌍
These are all for the Earth... 😭
Okay, let's find a way to create a CUSTOM IMAGINARY map.
Tools to build maps
Backend renderer:
- Osmarender: Converts OSM file into SVG with an XML stylesheet
- Mapnik: Very advanced solution using PostGIS with tons of features
- + A web-application to publish it online
- + Maybe other tools I have not heard about...
Data Provider:
Well... Any database, but maybe PostgreSQL + PostGIS is the best for this purpose
Front-end renderer:
- LeafletJS is the best option!
Tools that I used
Backend renderer:
- PHP/Symfony web application
- ImageMagick to create map tiles from an image
- Entities and database managed with Doctrine
- Frontend assets compiled with Gulp.js
Data Provider:
- A simple MySQL database
Front-end renderer:
-
LeafletJS is the best option!
Did you read the previous slide? 😉
Reminder:
The previously indicated tools are not the best options
(except Leaflet which is awesome)
Please use Mapnik + PostgreSQL + PostGIS + Leaflet.
Don't hurt yourself like I did.
Advantages to this stack
- Symfony is good for programming
- The web part is straightforward
- I
struggledlearnt about relations & perfs with MySQL
- Well, LeafletJS 🍃
- I learnt ImageMagick ✨, graph theory, map & coordinate science...
- Reimplemented Dijkstra algorithm in PHP
- MySQL has support for geographical data, but I didn't know that back then.
- Doctrine has no native support for geographical types. Some extensions exist, but they use PostGIS.
-
Implementing Dijkstra algorithm in PHP has a cost in terms of performances.
- Since it's PHP, I had to find a proper way to send all data to Leaflet for front-end rendering. It also has a cost.
Disdvantages to this stack
Technical details
Shortest path problem
Shortest path problem
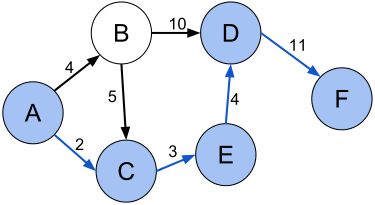
Shortest path problem
Shortest path problem
-
Dijkstra, most known, works with non-negative weights, lots of implementations.
-
Bellman–Ford, can handle negative weights.
-
A*, most known for games, can handle huge graphs.
- Floyd–Warshall's algorithm, Johnson's algorithm, Viterbi algorithm...
Solving algorithms:
Shortest path problem
A* algorithm

Shortest path problem
Dijkstra's algorithm

Let's pick this one!
Calculate coordinates
Map coordinates system & projection
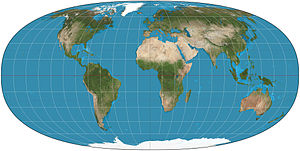
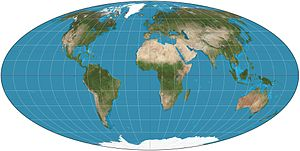
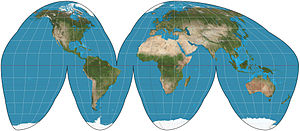
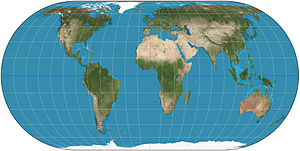
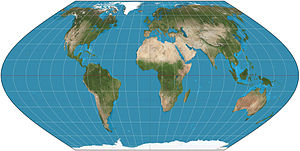
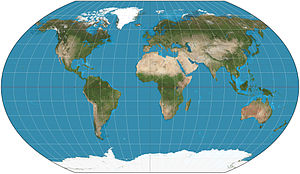
Map coordinates system & projection

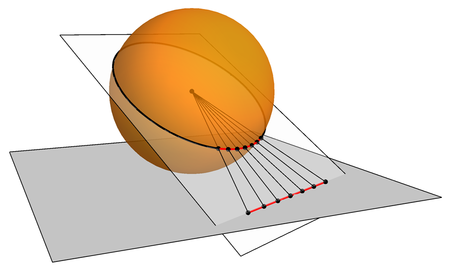
Map coordinates system & projection
Most famous: Mercator projection
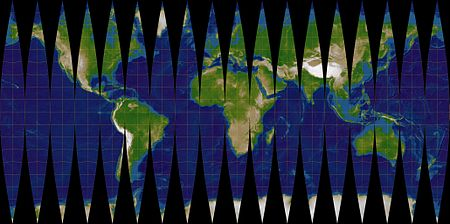
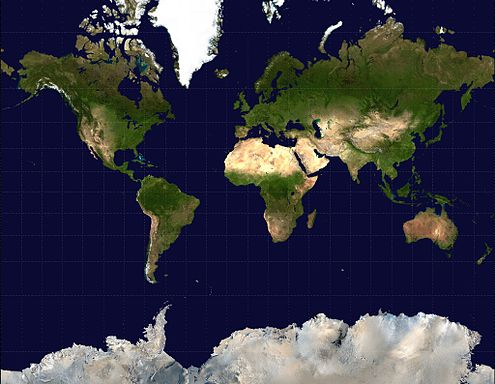
Map coordinates system & projection
Solution for us:
bitmap-like
In a 10×10 2D space:
x = 0 → left
x = 10 → right
y = 0 → top
y = 10 → bottom
Frontend rendering
with LeafletJS
🍃
LeafletJS:
Awesome docs!
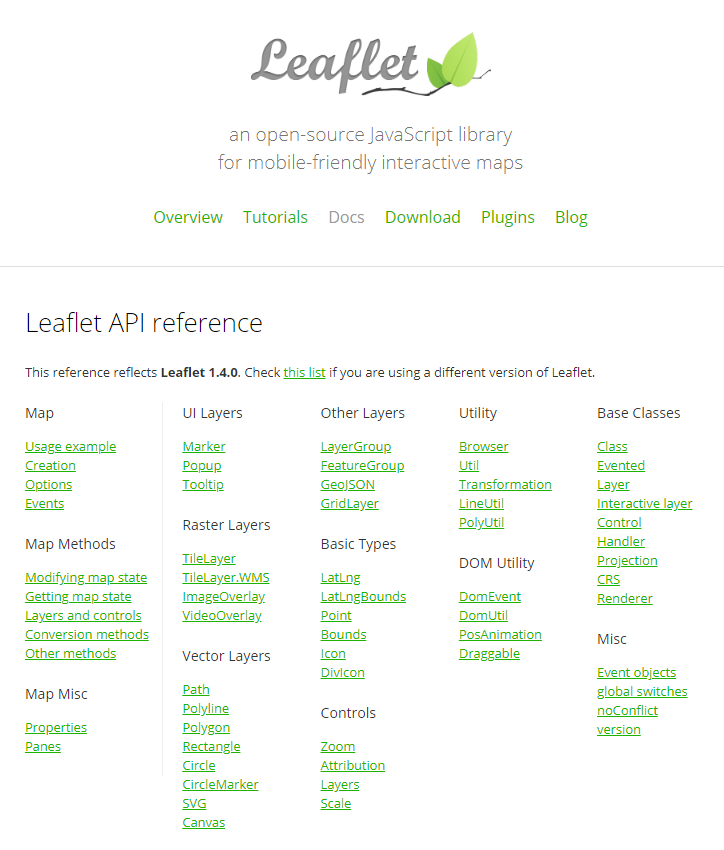
Easy to set up
// Matches a #map selector
var containerId = 'map';

var map = L.map(containerId);

// This is for OpenStreetMap's default map layer
L.tileLayer('https://{s}.tile.openstreetmap.org/{z}/{x}/{y}.png').addTo(map);
// Add a marker on the map
var marker = L.marker([51.5, -0.09]).addTo(mymap);
// Add a polygon on the map
var polygon = L.polygon([[51.509, -0.08], [51.503, -0.06],[51.51, -0.047]]).addTo(mymap);
// Add a multipoint line on the map
var polyline = L.polyline([[51.509, -0.08], [51.51, -0.047]]).addTo(mymap);
Map coordinates system & projection
By default, Leaflet uses Spherical Mercator projection, and uses mathematical rules to calculate distances & coordinates
L.CRS.EPSG3857 = Util.extend({}, Earth, {
    code: 'EPSG:3857',
    projection: SphericalMercator,
    transformation: (function() {
        var scale = 0.5 / (Math.PI * SphericalMercator.R);
        return toTransformation(scale, 0.5, -scale, 0.5);
    }())
});
export var SphericalMercator = {
R: 6378137,
MAX_LATITUDE: 85.0511287798,
project: function(latlng) {
var d = Math.PI / 180,
max = this.MAX_LATITUDE,
lat = Math.max(Math.min(max, latlng.lat), -max),
sin = Math.sin(lat * d);
return new Point(
this.R * latlng.lng * d,
this.R * Math.log((1 + sin) / (1 - sin)) / 2);
},
unproject: function(point) {
var d = 180 / Math.PI;
return new LatLng(
(2 * Math.atan(Math.exp(point.y / this.R)) - (Math.PI / 2)) * d,
point.x * d / this.R);
},
bounds: (function() {
var d = 6378137 * Math.PI;
return new Bounds([-d, -d], [d, d]);
})()
};Map coordinates system & projection
Simplify all the things!
L.CRS.XY = L.Util.extend({}, L.CRS.Simple, {
    code: 'XY',
    projection: L.Projection.LonLat,
    transformation: new L.Transformation(1, 0, 1, 0)
});
This tells LeafletJS to calculate coordinates on an [x,y] simple 2D system
But that's not finished...
Map coordinates system & projection
By default, LonLat projection (classic 2D) is still similar to Mercator in a point:
y = 0 is bottom
y = 10 is top
Let's reverse this!
L.LatLngBounds.prototype.extend = function (obj) {
    if (!obj) { return this; }

    var latLng = L.latLng(obj);
    if (latLng !== null) {
        obj = latLng;
    } else {
        obj = L.latLngBounds(obj);
    }

    if (obj instanceof L.LatLng) {
        if (!this._southWest && !this._northEast) {
            this._southWest = new L.LatLng(obj.lat, obj.lng);
            this._northEast = new L.LatLng(obj.lat, obj.lng);
        } else {
            // Here we set "max" instead of "min" in the original code
            this._southWest.lat = Math.max(obj.lat, this._southWest.lat);
            this._southWest.lng = Math.min(obj.lng, this._southWest.lng);

            // Here we set "min" instead of "max" in the original code
            this._northEast.lat = Math.min(obj.lat, this._northEast.lat);
            this._northEast.lng = Math.max(obj.lng, this._northEast.lng);
        }
    } else if (obj instanceof L.LatLngBounds) {
        this.extend(obj._southWest);
        this.extend(obj._northEast);
    }
    return this;
};
Only the 2 lines after each comment are custom.
The rest is copy/pasted from Leaflet.
Backend & data source
Old diagram
New diagram
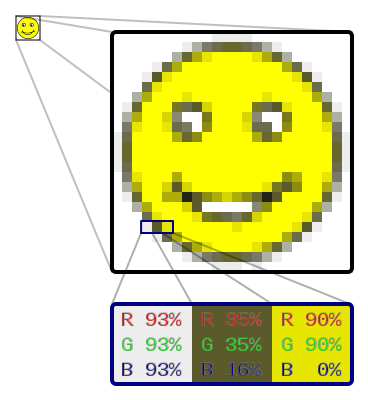
Creating image tiles
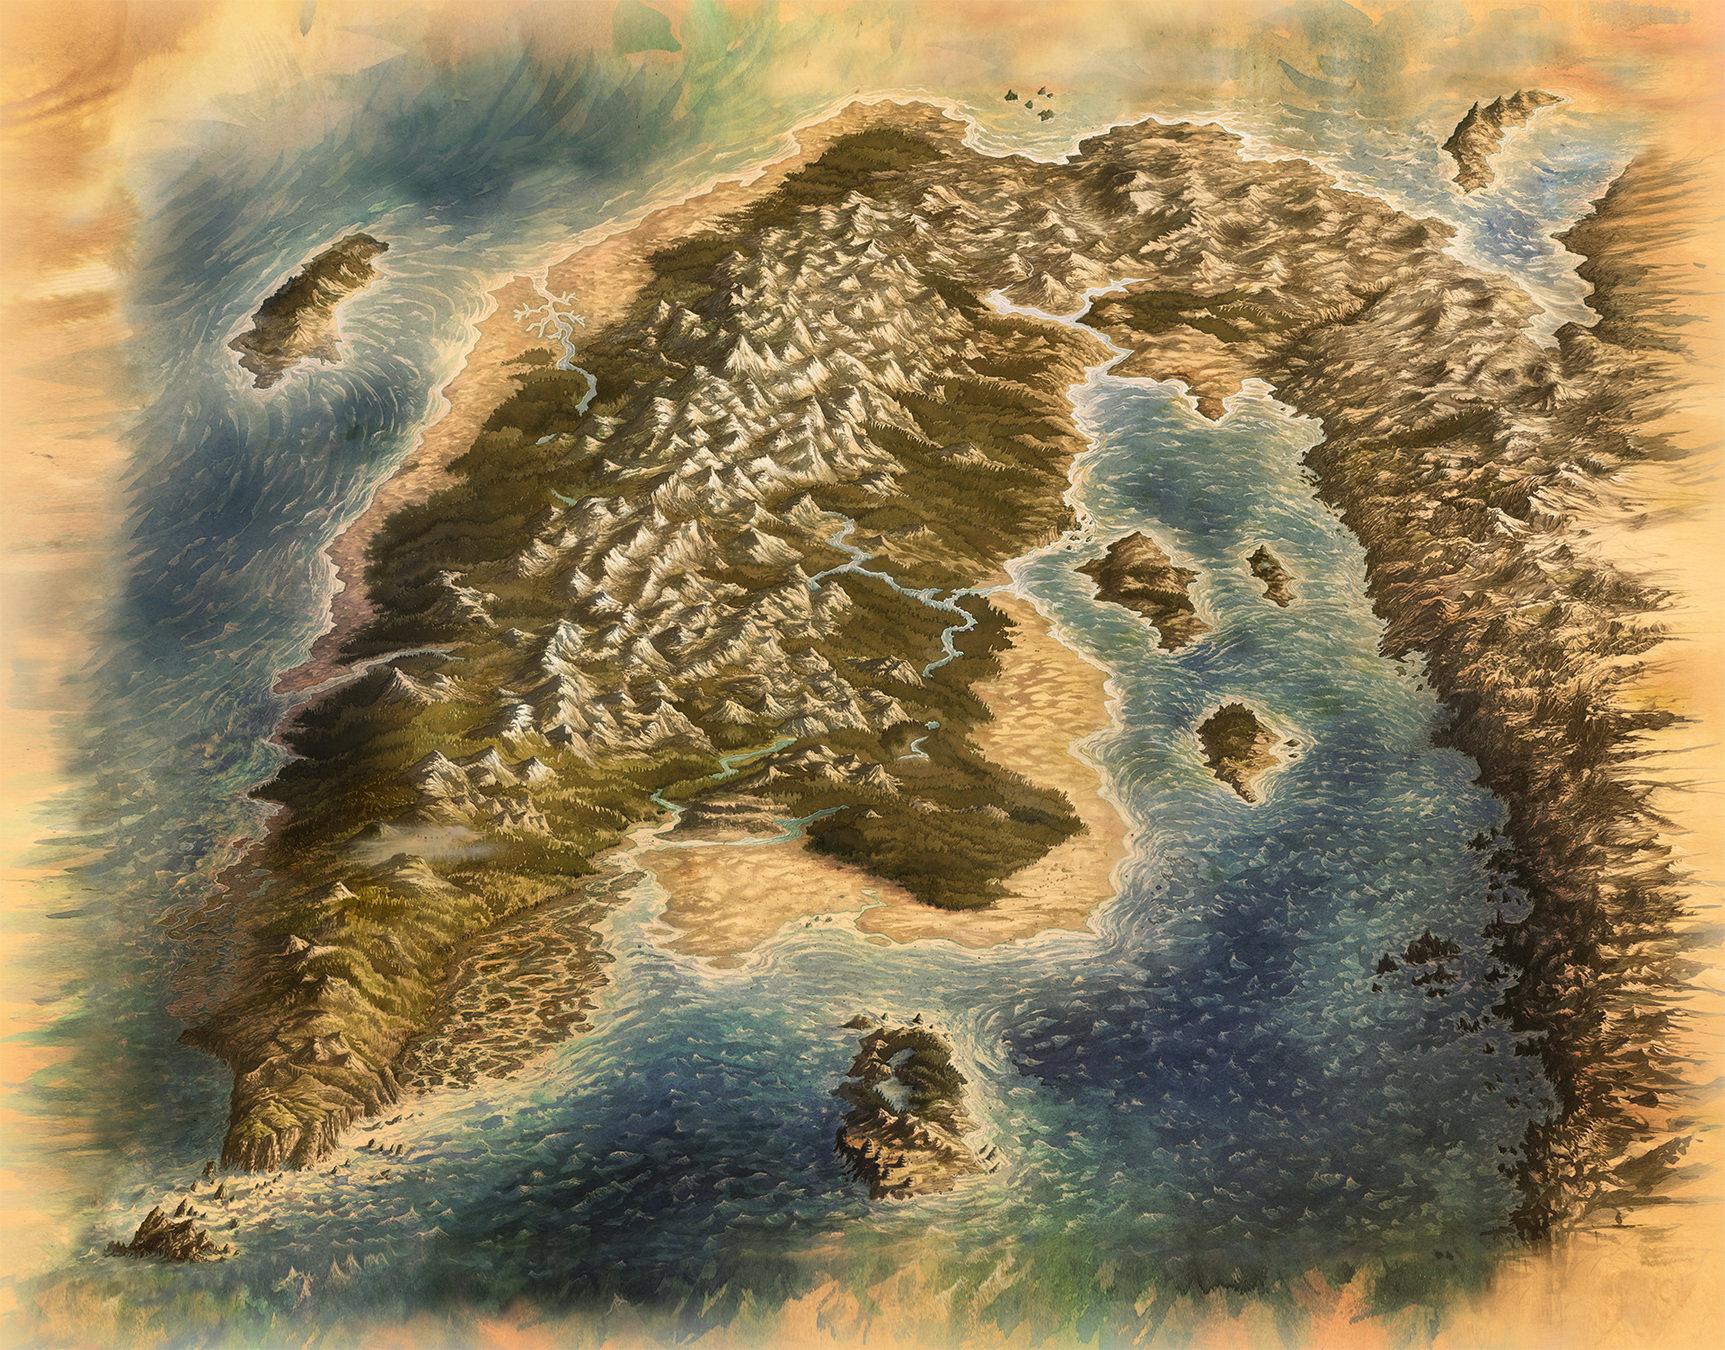
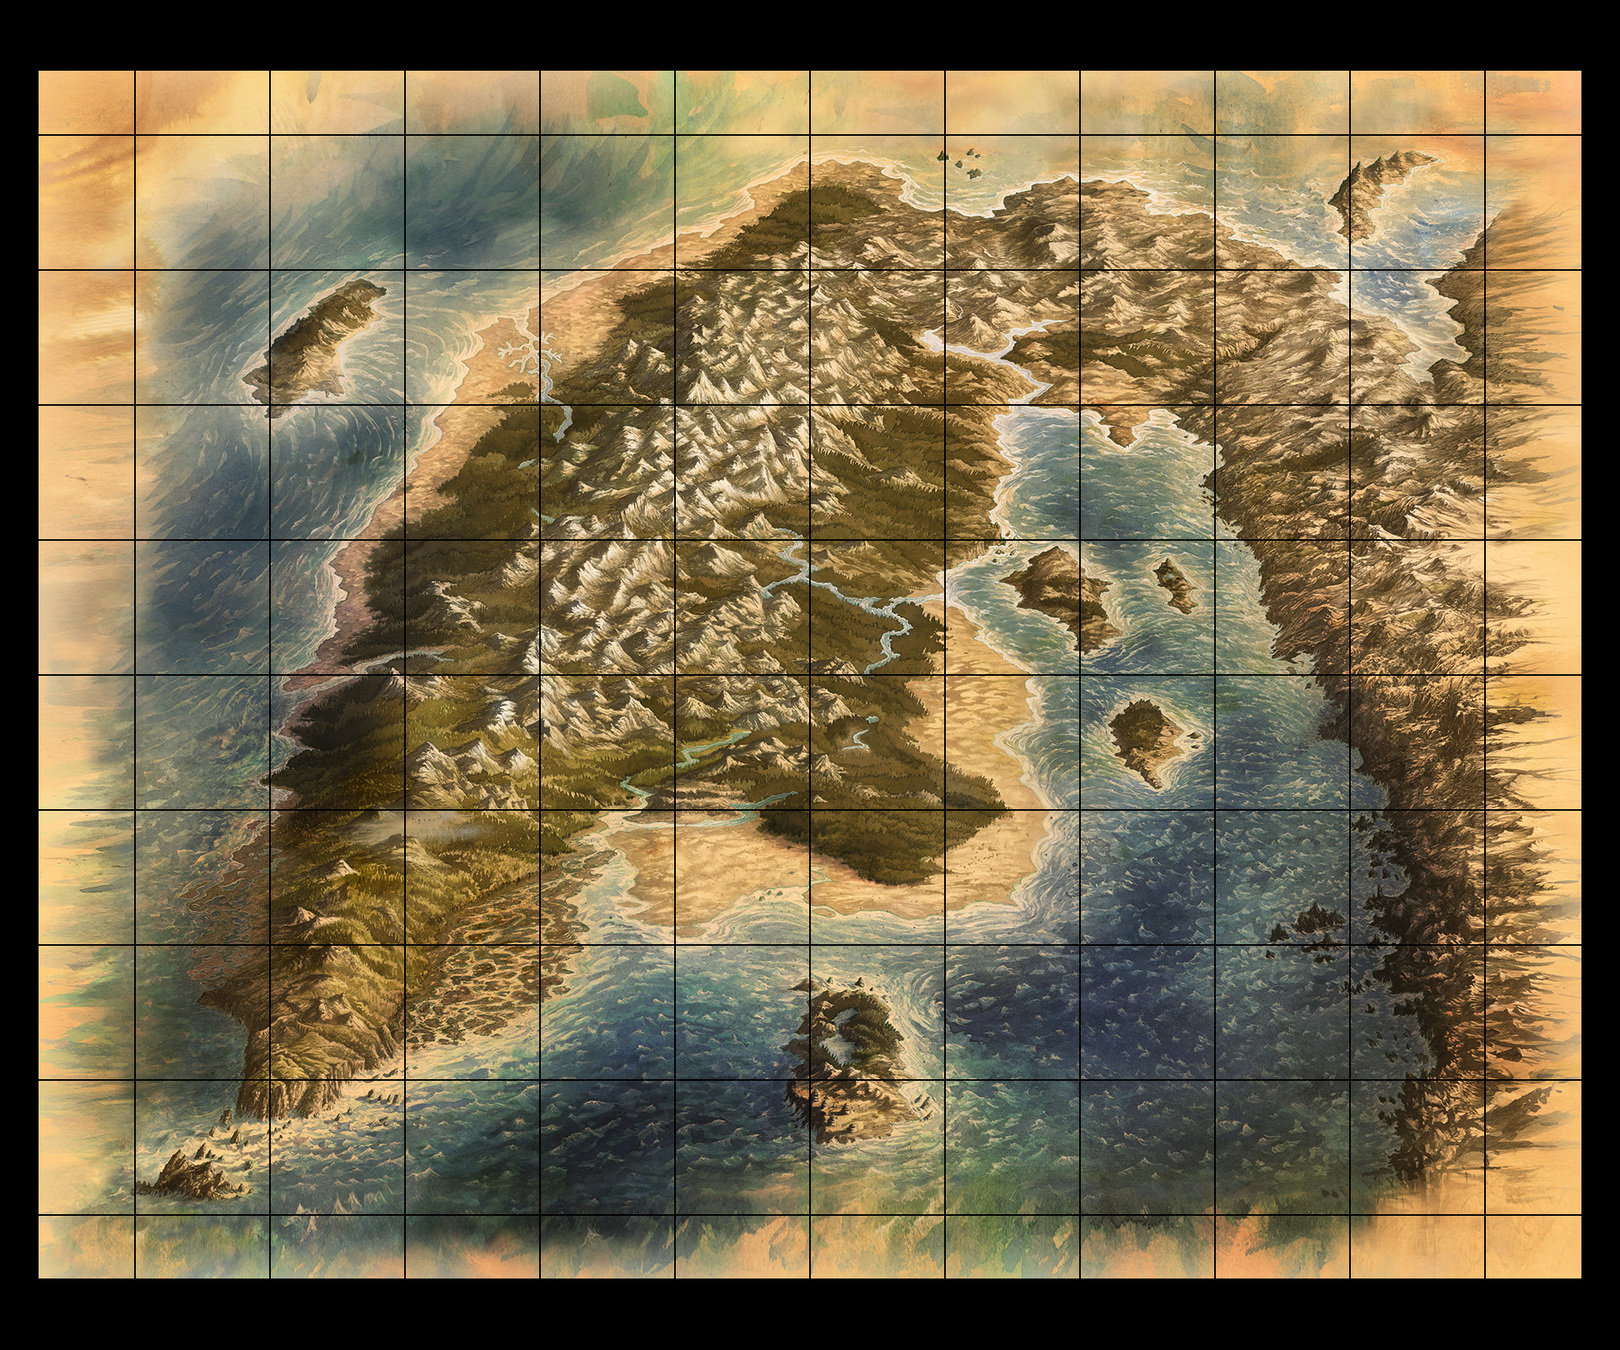
Original map is 5433×4252 pixels wide.
I opted for 5 zoom levels.
With Leaflet, it's interpreted like this:
- Zoom level 1 = "farthest" (tiny map)
- Zoom level 5 = "closer" (original map size)
The higher the zoom, the more details you want on your map.
Determine zoom levels
Equation to get the ratio for a given level:
- 6.25 %
- 12.5 %
- 25 %
- 50 %
- 100 %
Ratios for 5 zoom levels:
Determine zoom levels
Determine zoom levels
ImageMagick commands:
magick convert original_map.jpg
    -background "#000000" -extent "5433x5433" -resize "3.125%" -crop 168x168
    -background "#000000" -extent "168x168" -thumbnail "168x168" "output/$MAP_ID/0.jpg"

magick convert original_map.jpg
    -background "#000000" -extent "5433x5433" -resize "6.25%" -crop 168x168
    -background "#000000" -extent "168x168" -thumbnail "168x168" "output/$MAP_ID/1.jpg"

magick convert original_map.jpg
    -background "#000000" -extent "5433x5433" -resize "12.5%" -crop 168x168
    -background "#000000" -extent "168x168" -thumbnail "168x168" "output/$MAP_ID/2.jpg"

magick convert original_map.jpg
    -background "#000000" -extent "5433x5433" -resize "25%" -crop 168x168
    -background "#000000" -extent "168x168" -thumbnail "168x168" "output/$MAP_ID/3.jpg"

magick convert original_map.jpg
    -background "#000000" -extent "5433x5433" -resize "50%" -crop 168x168
    -background "#000000" -extent "168x168" -thumbnail "168x168" "output/$MAP_ID/4.jpg"

magick convert original_map.jpg
    -background "#000000" -extent "5433x5433" -resize "100%" -crop 168x168
    -background "#000000" -extent "168x168" -thumbnail "168x168" "output/$MAP_ID/5.jpg"
Side-note
ImageMagick options "-extent", "-resize", "-thumbnail" and "-crop" need a "geometry" argument.
Sources:
I made a regex for that:
(?<size>(?<w>(?:\d*(?:\.\d+)?)?%?)?(?:x(?<h>(?:\d*(?:\.\d+)?)?%?))?)(?<aspect>[!><@^])?(?<offset>(?<x>[+-]\d*(?:\.\d+)?)?(?<y>[+-]\d*(?:\.\d+)?)?)(and an additionnal validator for non-regex-related checks)
Determine zoom levels
$ tree maps_tiles/$MAP_ID/
75 directories, 1498 files
👍
ImageMagick output needs some sorting/renaming to be integrated in LeafletJS as a map tile layer.
And after that:
Manage all of that data
Want a glimpse of the rendering?
Search for elements in the map
Calculate a direction
Merci !
@pierstoval